Image Details
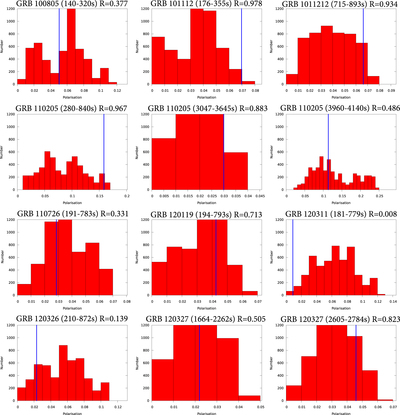
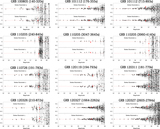
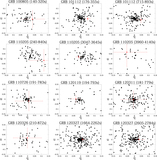
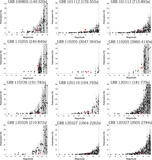
Caption: Figure 8.
Distribution of possible polarization values for each GRB. The histograms are constructed using all possible permutations of the eight flux values measured for that GRB and have equal bin size P = 1%. The data are corrected for both instrumental polarization and depolarization. The vertical (blue) line indicates the measured value for the GRB. The normalized rank (R) of the GRB within the distribution is indicated. For sources with ﹩R\lt 0.9﹩ we conclude that the measured flux values are consistent with zero polarization and use the maximum permutated value to derive an upper limit.
Other Images in This Article
Show More
Copyright and Terms & Conditions
© 2017. The American Astronomical Society. All rights reserved.
Copyright ©
2026 Astronomy Image Explorer. All Rights Reserved.