Image Details
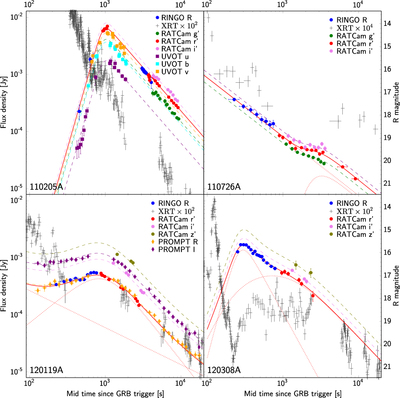
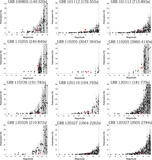
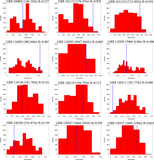
Caption: Figure 10.
GRB 110205A, GRB 110726A, GRB 120119A, and GRB 120308A for which the light curves show definite structure. The Beuermann and PL components defined in Table 4 are plotted individually as dotted lines, and the final r-band model fit (the summation of the multiple components) is plotted as a solid line. To more easily compare the light-curve shape between filters by eye, the model is plotted multiple times offset to align with the non-﹩r^{\prime} ﹩ band filters and plotted as a dashed line. The steep rise for GRB 110205A and GRB 120308A indicates the presence of the reverse-shock component in the afterglow.
Other Images in This Article
Show More
Copyright and Terms & Conditions
© 2017. The American Astronomical Society. All rights reserved.