Image Details
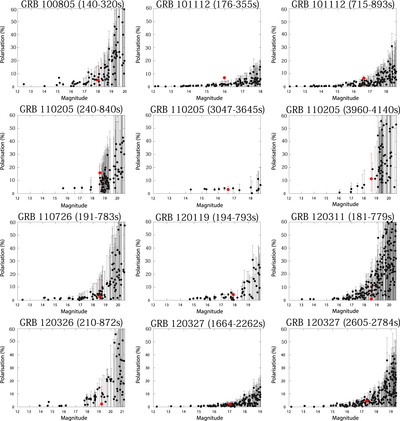
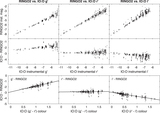
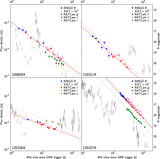
Caption: Figure 7.
Observed polarization for GRBs (red points) and the other objects in the same frame (black points) as a function of magnitude. The magnitude is derived directly from the count rate of each object assuming a constant zero-point and is therefore not corrected for variations in sky transparency between different frames. The data are corrected for instrumental polarization and depolarization. The error bars are calculated from a Monte Carlo simulation based on simulating a range of P from 0.01 to 70.00% for each object and then generating a distribution of q and u values and hence a distribution of simulated possible measured P values corresponding to the input distribution. If the observed P lies in the 14th–86th percentile (corresponding to 1σ for a Gaussian distribution), then it is flagged as a possible true P value. The highest and lowest possible P values therefore give the error bar. As the count rate decreases, both the polarimetric error and polarization value increase. The apparent increase in polarization value is the effect of polarization bias where noise is transformed into signal via the polarization Equation (3).
Other Images in This Article
Show More
Copyright and Terms & Conditions
© 2017. The American Astronomical Society. All rights reserved.