Image Details
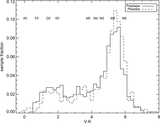
Caption: Figure 7.
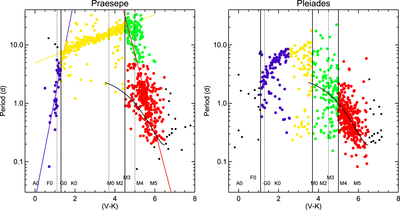
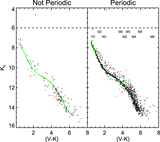
Plot of P vs. (V−Ks) for Praesepe (left) and the Pleiades (right), with additional color coding indicating regions discussed here and in Rebull et al. (2016b) and Stauffer et al. (2016). Obvious pulsators have been removed in both plots. Black points in both plots have been omitted as outliers for the purpose of fitting the lines. For Praesepe, colored points are as follows. Blue is (V−Ks) < 1.3; yellow is 1.3 < (V−Ks) < 4.5; green and red are both (V−Ks) > 4.5, but those with P > 5 are green and those with P< 5 are red. Linear fits are also shown in the blue, yellow, and red+green regimes. For the Pleiades, colored points follow Stauffer et al. (2016), Figure 24: blue is 1.1 < (V−Ks) 0 < 2.6 and yellow is 2.5 < (V - Ks) 0 < 3.7. The bulk of the distribution through both of these regions trace out the “slowly rotating sequence”; the transition to yellow is placed at the location of the “kink” in the slowly rotating sequence. Green is 3.7 < (V−Ks) 0 < 5, the “disorganized region”; red is (V−Ks) 0 > 5, the “fast sequence.” The vertical lines are the same as the prior figure. The curved black line is the fit to the Pleiades M stars from Stauffer et al. (2016) and is the same in both panels. The M star relation is steeper in Praesepe.
Other Images in This Article
Show More
Copyright and Terms & Conditions
© 2017. The American Astronomical Society. All rights reserved.