Image Details
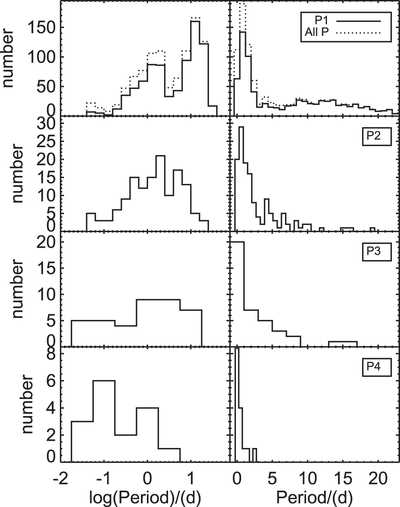
Caption: Figure 5.
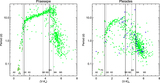
Histograms, on the left, of the log of periods, and on the right, of the linear periods, found by our analysis, in days. Solid line is the primary period (which which we take to be the rotation period of the star), and dotted line is (for reference) a histogram of all the periods found here, including the secondary, tertiary, and quaternary periods found here (see Section 4). There are two peaks, one near ∼1 day and one near ∼10–15 days. The faster peak corresponds largely to M stars, and the slower peak is primarily more massive stars. A significant fraction of the tertiary and quaternary periods are from likely pulsators.
Other Images in This Article
Show More
Copyright and Terms & Conditions
© 2017. The American Astronomical Society. All rights reserved.