Image Details
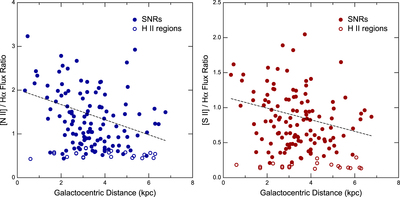
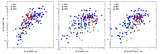
Caption: Figure 8.
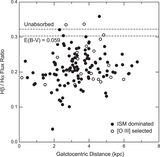
Plots of the flux ratio of [N II] λλ 6548, 6583/Hα (left) and [S II] λλ 6716, 6731/Hα (right) as a function of deprojected galactocentric distance (GCD) for the ISM-dominated SNRs (filled circles), and also for the H II regions for which we have spectra (open circles). The dashed lines indicate the best linear fits for ratios for the SNRs, but the implied gradient is of marginal significance given the large scatter in the ratio values. In contrast, the H II region line ratios are well-behaved and show no evidence of a gradient. The large scatter for the SNRs must result from some combination of varying local abundances and varying shock conditions (see the text).
Other Images in This Article
Show More
Copyright and Terms & Conditions
© 2017. The American Astronomical Society. All rights reserved.