Image Details
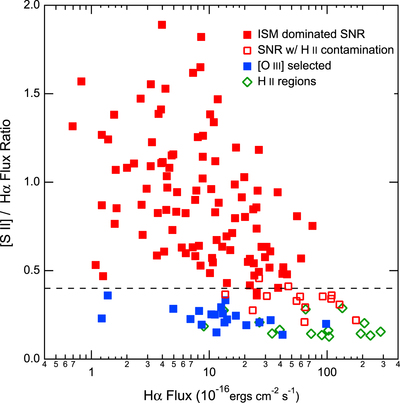
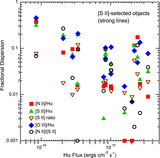
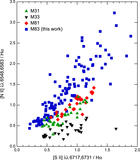
Caption: Figure 6.
Plot of the ratio of [S II] λλ 6716, 6731/Hα flux as a function of the Hα flux level for all the objects we observed spectroscopically. Filled red squares are SNRs and candidates selected on the basis of high [S II]/Hα ratios in narrow-band images (Table 2 from B12 and Table 2 from D10). For virtually all of these, the spectra confirm the high [S II]/Hα ratio. Inspection of the WFC3 images for candidates with marginal ratios ([S II]/Hα ≲ 0.4) shows that most of these are also bona fide SNRs, but with spectra contaminated by coincident H II emission; these are shown as open red squares. Filled blue squares are objects selected on the basis of a high [O III]/Hα ratio in images (Table 3 from B12 and Table 4 from D10). Also shown are a number of known H II regions targeted in our survey (open green symbols). Most of the [O III]-selected objects appear to be either PNe or high-excitation H II regions. No strong trend of the ratio with Hα flux is evident.
Other Images in This Article
Show More
Copyright and Terms & Conditions
© 2017. The American Astronomical Society. All rights reserved.