Image Details
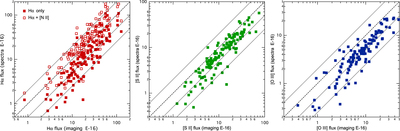
Caption: Figure 5.
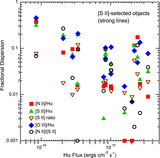
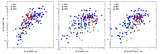
(Left) Comparison between the Hα fluxes measured from narrow-band images (horizontal axis) and those measured from the extracted 1D spectra (vertical axis). Also shown (open squares) is the sum of the Hα + [N II] λλ 6548, 6583 flux from the spectra, since the narrow-band filter used for imaging passed a fraction of the [N II] flux. The heavy dashed line corresponds to equal values, while the lighter ones correspond to ﹩{F}_{\mathrm{spectra}}=1/4,1/2﹩, and ﹩2\times {F}_{\mathrm{image}}﹩. (Center) Same, but for the [S II] λλ 6716, 6731 flux. (Right) Same, but for the [O III] λ 5007 flux. The most extreme point, with ﹩{F}_{\mathrm{spectra}}\ll {F}_{\mathrm{imaging}}﹩ in all three lines, is a single object that was largely off the GMOS slit.
Other Images in This Article
Show More
Copyright and Terms & Conditions
© 2017. The American Astronomical Society. All rights reserved.