Image Details
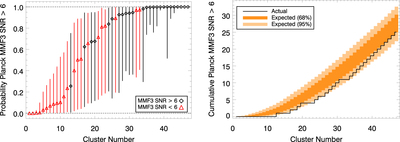
Caption: Figure 6.
Left: the probability for each BoXSZ+ cluster to be detected with SNR > 6 by Planck using the MMF3 algorithm in ascending order of detection probability. The probability is computed using the Bolocam measurement of ﹩{Y}_{5{\rm{R}}500}﹩, rescaled according to the linear fit shown in Figure 5. Black diamonds denote the clusters actually detected by Planck and red triangles denote non-detections. The vertical bars represent the range of probabilities predicted from the Bolocam measurement of ﹩{Y}_{5{\rm{R}}500}﹩, with most of the uncertainty due to the intrinsic scatter in the linear model used to rescale the Bolocam measurements. Right: 68% (dark orange) and 95% (light orange) confidence regions for the total cumulative number of Planck MMF3 clusters with SNR > 6 based on the detection probabilities given in the left plot. The actual cumulative number of Planck detections is given as a solid black line, and is consistent with, but somewhat low, compared to the predictions based on Bolocam.
Other Images in This Article
Copyright and Terms & Conditions
© 2016. The American Astronomical Society. All rights reserved.