Image Details
Caption: Figure 2.
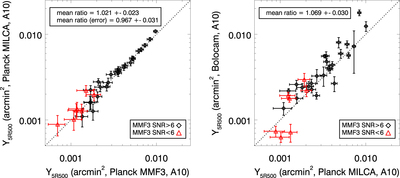
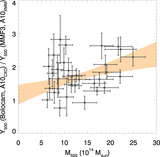
Left: the value of ﹩{Y}_{5{\rm{R}}500}﹩ obtained from A10 fits to the Planck MILCA y-maps compared to the value of ﹩{Y}_{5{\rm{R}}500}﹩ recovered from Planck using the MMF3 algorithm. On average, the two results are consistent. Right: the value of ﹩{Y}_{5{\rm{R}}500}﹩ obtained from A10 fits to the Bolocam data compared to the value of ﹩{Y}_{5{\rm{R}}500}﹩ recovered from the Planck MILCA y-maps. Given the 5% flux calibration uncertainty on the Bolocam data, the two results are consistent on average. In both plots, clusters above the Planck cluster cosmology cut (MMF3 SNR > 6) are shown in black, while MMF3 detections below the cut are shown in red. Both plots contain all 32 BoXSZ+ clusters detected by Planck using the MMF3 algorithm.
Other Images in This Article
Copyright and Terms & Conditions
© 2016. The American Astronomical Society. All rights reserved.