Image Details
Caption: Figure 1.
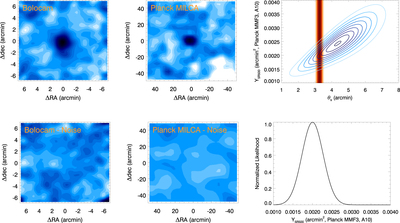
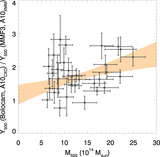
Examples of the SZ data used in this analysis for the cluster Abell 370. Left: Bolocam data (top) and 1 of the 1000 noise realizations (bottom) smoothed to an effective FWHM of 1.′4 for visualization (the unsmoothed data are used for all analyses). Middle: Planck MILCA y-map (top) and 1 of the 1000 noise realizations (bottom). Right, top: Planck MMF3 PDF (blue contours separated by 0.1 in probability) and the Planck XMM-like constraint on the value of ﹩{\theta }_{{\rm{s}}}﹩ (solid red, with each color separated by 0.1 in probability). Right, bottom: one-dimensional constraint on the value of ﹩{Y}_{5{\rm{R}}500}﹩ based on the Planck PDF and the XMM prior on ﹩{\theta }_{{\rm{s}}}﹩.
Other Images in This Article
Copyright and Terms & Conditions
© 2016. The American Astronomical Society. All rights reserved.