Image Details
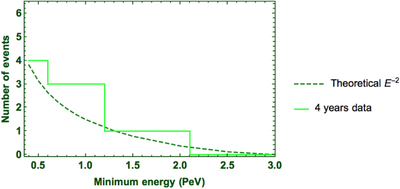
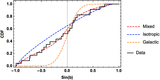
Caption: Figure 6.
Comparison between theoretical prediction and data observed between a minimum energy and 3 PeV. The line represents the energy in which the number of events between Emin and 3 PeV decreases by 1.
Other Images in This Article

Copyright and Terms & Conditions
© 2016. The American Astronomical Society. All rights reserved.
Copyright ©
2025 Astronomy Image Explorer. All Rights Reserved.