Image Details
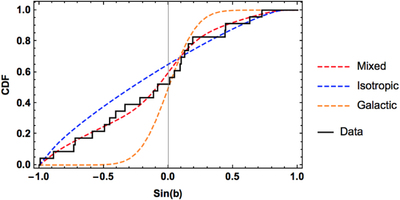
Caption: Figure 5.
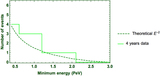
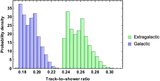
Results of different hypothesis tests for isotropic, galactic, and mixed models. In the bottom of the panel, the comparison is made between the cumulative density function of the three models and southern sky data above 60 TeV.
Other Images in This Article

Copyright and Terms & Conditions
© 2016. The American Astronomical Society. All rights reserved.
Copyright ©
2025 Astronomy Image Explorer. All Rights Reserved.