Image Details
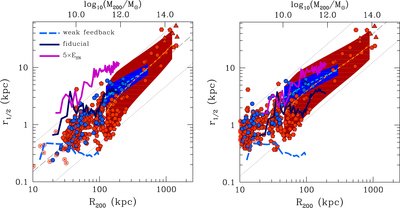
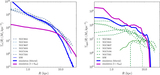
Caption: Figure 4.
Left: 3D half-mass radius–R200 radius relation of galaxies, where R200 is the radius enclosing density contrast of 200 relative to the critical density. Right: the same relation but with R200 of observed galaxies corrected approximately for pseudo-evolution (see text for details). The simulations are shown by the solid blue (fiducial), magenta (ALL_Efb_e001_5ESN), and dashed light-blue (low star formation efficiency, weak feedback) lines, which are identical in both panels. The ﹩{R}_{200}(z)﹩ radius is measured for the simulated galaxies at the redshift of analysis. As shown by Kravtsov (2013), the observed galaxies at ﹩z\approx 0﹩ on average follow a nearly linear relation, ﹩{r}_{1/2}\approx 0.015{R}_{200}﹩ spanning more than eight orders of magnitude in stellar mass. The red pentagons and hexagons show a sample of elliptical and dwarf elliptical galaxies from the compilation of Misgeld & Hilker (2011); blue circles are the late-type galaxies from the samples of Leroy et al. (2008) and Zhang et al. (2012), with half-mass radii calculated directly from the deprojected surface density profiles, while the star symbol shows the Milky Way; the red cartwheel points show the Local Group dwarf spheroidal galaxies from the compilation of Misgeld & Hilker (2011). The light-blue dashed line and dot-dashed orange line show the average relations derived for late- and early-type galaxies, respectively, from the average ﹩{R}_{{\rm{1/2}}}\mbox{--}{M}_{\star }﹩ relations of Bernardi et al. (2014). The dark red shaded band shows ﹩2\sigma ﹩ scatter around the mean relation calculated for all galaxies in the Bernardi et al. (2014) sample. The orange dot-dashed line with error bars shows the mean relation and ﹩2\sigma ﹩ scatter for massive SDSS galaxies presented in Szomoru et al. (2013); individual galaxies from this sample are shown by blue (Sérsic index ﹩n\lt 2.5﹩) and red (﹩n\gt 2.5﹩) dots. The gray dashed line shows the linear relation ﹩{r}_{1/2}=0.015{R}_{200}﹩, and dotted lines are linear relations offset by 0.5 dex, which approximately corresponds to the scatter in galaxy sizes from distribution of halo spin parameter λ under the assumption that ﹩{r}_{1/2}\propto \lambda {R}_{200}﹩.
Other Images in This Article
Copyright and Terms & Conditions
© 2016. The American Astronomical Society. All rights reserved.