Image Details
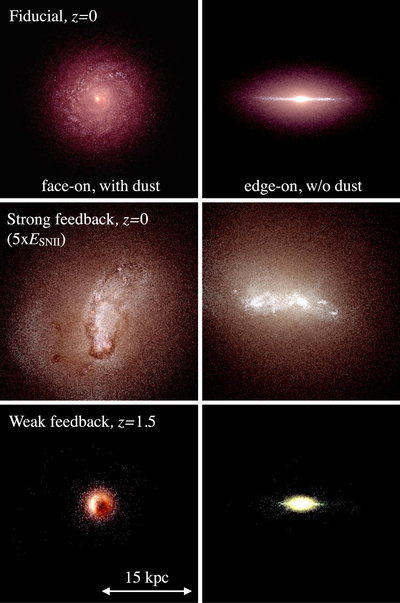
Caption: Figure 1.
Mock ﹩g,r,i﹩ composite images of the three simulations at their final output, shown face-on in the left column and edge-on in the right column. The images are constructed assuming single stellar population spectral energy distributions from STARBURST99 (Leitherer et al. 1999) for each star particle, given its known age and metallicity, and then ray-tracing the line-of-sight flux. In the face-on images, the flux is attenuated using an MW-like reddening curve (Weingartner & Draine 2001) with a dust-to-gas ratio vs. gas metallicity relation compatible with Fisher et al. (2014). The galaxy in the run with low star formation efficiency (bottom row) features a very compact morphology at z = 1.5, in stark contrast to the fiducial model, which features a well-defined galactic disk at z = 0 (upper row). The model with boosted energy per SN (middle row) fails to form a thin disk, as star formation occurs in an extended and highly turbulent gaseous system.
Other Images in This Article
Copyright and Terms & Conditions
© 2016. The American Astronomical Society. All rights reserved.