Image Details
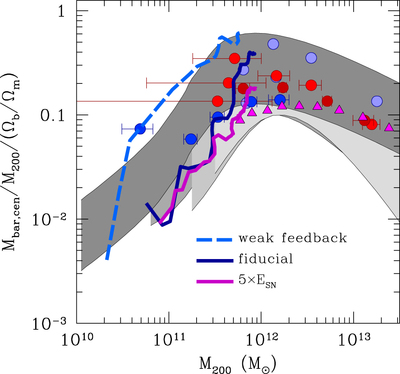
Caption: Figure 2.
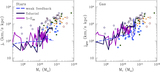
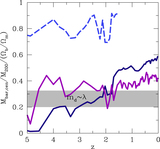
Evolution of the stellar mass fraction in units of the universal baryon fraction as a function of halo mass. The shaded regions show, from light to dark gray, the ﹩z=3,2,1﹩ data from Behroozi et al. (2013) and z = 0 from Kravtsov et al. (2014), where the gray bands show the region ﹩\pm 2\sigma ﹩ around the mean relation. The points show observational inferences of stellar fractions for galaxies at ﹩z\approx 0﹩ using weak lensing (circles) for late-type (blue) and early-type (red) systems by Mandelbaum et al. (2006) and Hudson et al. (2015). Magenta triangles show estimates using satellite kinematics by More et al. (2011).
Other Images in This Article
Copyright and Terms & Conditions
© 2016. The American Astronomical Society. All rights reserved.