Image Details
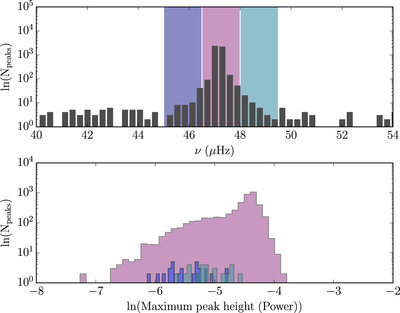
Caption: Figure 9.
Top: histogram of the frequencies of the highest peaks in the LS periodograms of the Vanderburg & Johnson (2014) light curves of 4923 K2 targets within the range 40–54 μHz. Bottom: histograms of peak heights within the correspondingly colored ranges indicated in the top panel. The frequency of maximum peak height was ∼47 μHz in almost every periodogram. Furthermore, the distribution of maximum peak height within the range 46.5–48 μHz is skewed toward higher powers, i.e., a large fraction of the peaks at ∼47 μHz have a large power.
Other Images in This Article

Copyright and Terms & Conditions
© 2016. The American Astronomical Society. All rights reserved.
Copyright ©
2025 Astronomy Image Explorer. All Rights Reserved.