Image Details
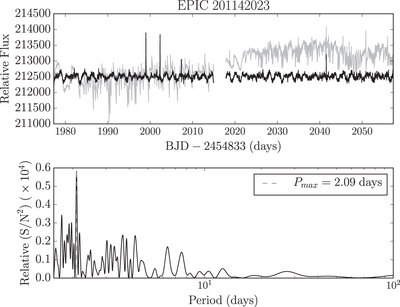
Caption: Figure 6.
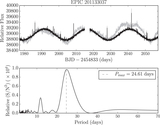
Top: the raw light curve of EPIC 201142043 is shown in gray and the conditioned light curve is shown in black. The conditioned light curve is produced by removing the trends that best describe the data, at the best fitting frequency. Bottom: an SIP, produced by modeling the data as a linear combination of the top 150 ELCs plus a sine and cosine function at a range of frequencies, measuring a rotation period of 2 days. The SIP is, by definition, insensitive to the long-timescale systematics that dominate the LS periodogram of the detrended data, shown in Figure 5.
Other Images in This Article

Copyright and Terms & Conditions
© 2016. The American Astronomical Society. All rights reserved.
Copyright ©
2025 Astronomy Image Explorer. All Rights Reserved.