Image Details
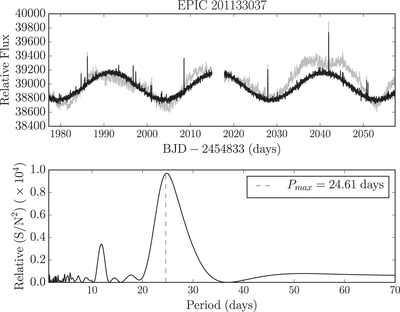
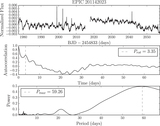
Caption: Figure 4.
Top: the raw light curve of EPIC 201133037 is shown in gray and the conditioned light curve is shown in black. The conditioned light curve is produced by removing the trends that best describe the data, at the best fitting frequency. Bottom: an SIP of the raw light curve, produced by modeling the data using the top 150 ELCs plus a sine and cosine function at a range of frequencies. The highest peak in the SIP is located at 25 days.
Other Images in This Article

Copyright and Terms & Conditions
© 2016. The American Astronomical Society. All rights reserved.
Copyright ©
2025 Astronomy Image Explorer. All Rights Reserved.