Image Details
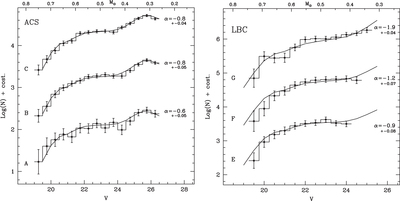
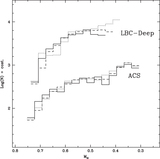
Caption: Figure 4.
Observed LFs of NGC 5466, as obtained in the six radial areas (see labels) defined in Figure 3, from the ACS (left panel) and the LBC (right panel) data sets. The LFs are shifted by an arbitrary amount to make the plot more readable. The theoretical LFs that best fit the data are shown as solid lines. The corresponding power-law indexes of the MF are marked in the figure. The top axis indicates the stellar masses corresponding to the observed V magnitudes.
Other Images in This Article
Copyright and Terms & Conditions
© 2015. The American Astronomical Society. All rights reserved.
Copyright ©
2025 Astronomy Image Explorer. All Rights Reserved.