Image Details
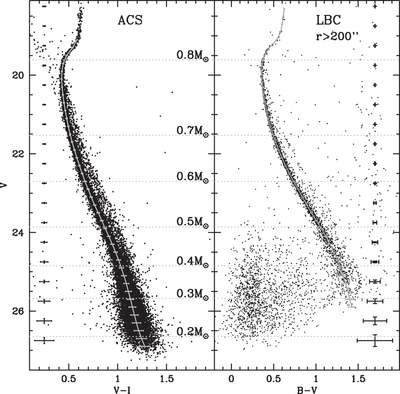
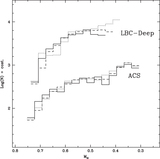
Caption: Figure 2.
CMDs of the ACS and the LBC samples (left and right panels, respectively). The mean ridge line is shown as a solid gray line and its 1σ color uncertainty is also marked at different magnitude levels. The typical photometric errors (magnitudes and colors) for the two samples are indicated by black crosses. The conversion of the V magnitude into stellar masses is done using the mass-to-light law from the best-fit isochrone from Dotter et al. (2007).
Other Images in This Article
Copyright and Terms & Conditions
© 2015. The American Astronomical Society. All rights reserved.
Copyright ©
2025 Astronomy Image Explorer. All Rights Reserved.