Image Details
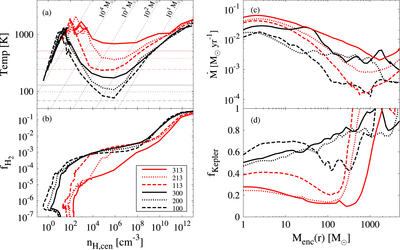
Caption: Figure 5.
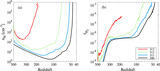
Evolution of temperature (Panel (a)) and H2 fraction (Panel (b)) at the center of the cloud. The horizontal lines in Panel (a) indicate the CMB temperature, ﹩{T}_{{\rm{CMB}}}(z)=2.73(1+z),﹩ at the respective formation epoch zform listed in Table 1. The dotted lines show the Jeans mass for 10–105 ﹩{M}_{\odot }﹩ in the density–temperature plane. Panels (c) and (d) display the profiles of the instantaneous gas infall rate and the degree of rotational support (fKepler = vrot/vKepler) as a function of the enclosed mass. The profiles are calculated when the cloud core density reaches ﹩{n}_{{\rm{H,cen}}}﹩ = 1013 ﹩{\mathrm{cm}}^{-3}﹩.
Other Images in This Article
Copyright and Terms & Conditions
© 2015. The American Astronomical Society. All rights reserved.