Image Details
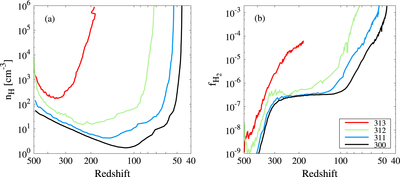
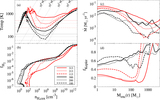
Caption: Figure 4.
Time evolution of gas density (Panel (a)) and H2 molecule fraction (Panel (b)) of the densest gas elements for cases with σ8 = 2.5 until ﹩{n}_{{\rm{H,cen}}}﹩ = 106 ﹩{\mathrm{cm}}^{-3}﹩. The lines with different colors represent the four PPS models in Table 1.
Other Images in This Article
Copyright and Terms & Conditions
© 2015. The American Astronomical Society. All rights reserved.
Copyright ©
2025 Astronomy Image Explorer. All Rights Reserved.