Image Details
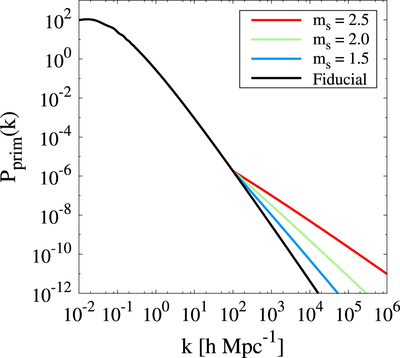
Caption: Figure 1.
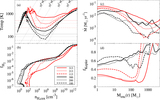
We plot the matter power spectra for the considered cases in the present paper with kp = 100 h Mpc−1. The black line is for the scale-independent PPS (Equation (1)), whereas the other three lines show the scale-dependent models given by Equation (2) with ms = 1.5 (blue), 2.0 (green), and 2.5 (red), respectively.
Other Images in This Article
Copyright and Terms & Conditions
© 2015. The American Astronomical Society. All rights reserved.
Copyright ©
2025 Astronomy Image Explorer. All Rights Reserved.