Image Details

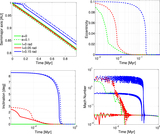
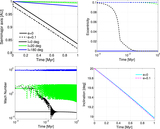
Caption: Figure 8.
Dependence of the timescales for orbital evolution obtained from numerical simulations. The shaded region is excluded due to gas dispersal after 10 Myr. Solid line indicates semimajor axis evolution timescale, ﹩{\tau }_{a}﹩(blue). Dashed lines indicate eccentricity evolution timescale, ﹩{\tau }_{e}﹩, for ﹩e=0.1﹩ (red) and ﹩e=0.3﹩ (green). Triangles indicate the inclination evolution timescale, ﹩{\tau }_{I}﹩, for a circular orbit with initial ﹩I=0.05﹩ rad. Note the logarithmic scales.
Other Images in This Article
Copyright and Terms & Conditions
© 2015. The American Astronomical Society. All rights reserved.
Copyright ©
2025 Astronomy Image Explorer. All Rights Reserved.