Image Details
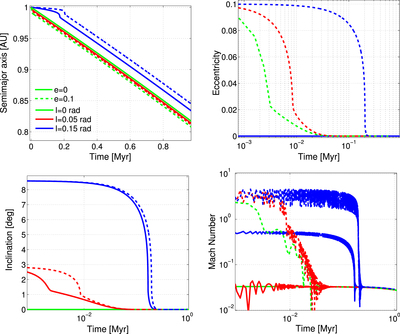
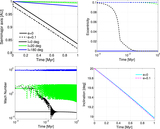
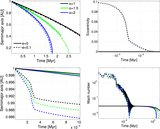
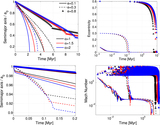
Caption: Figure 4.
Comparison of the orbital evolution of a ﹩2\cdot {10}^{25}\;{\rm{g}}﹩ planetesimal for a range of initial conditions. Solid lines correspond to circular orbits, e = 0. Dashed lines correspond to initially eccentric orbits, e = 0.1. The color index is green—I = 0, red—low inclination ﹩I\sim 2{H}_{0},﹩ blue—high inclination ﹩I\sim 6{H}_{0}.﹩ Top left: evolution of the semimajor axis. Top right: evolution of the eccentricity. Note the logarithmic scale. Bottom left: evolution of the inclination. Note the logarithmic scale. Bottom right: evolution of the Mach number. Note the logarithmic scale.
Other Images in This Article
Copyright and Terms & Conditions
© 2015. The American Astronomical Society. All rights reserved.
Copyright ©
2025 Astronomy Image Explorer. All Rights Reserved.