Image Details
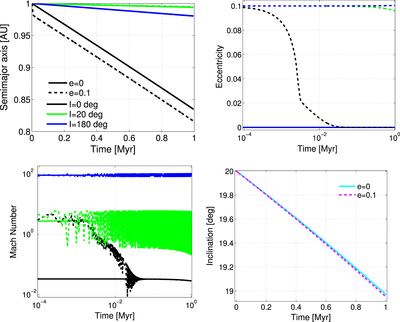
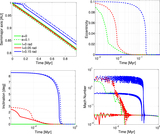
Caption: Figure 5.
Comparison between the evolution of planetesimals of ﹩m=2\cdot {10}^{25}\;{\rm{g}}﹩ with various initial inclinations and eccentricities. Solid lines indicate circular orbits, dashed lines indicate eccentric orbits with an initial eccentricity of e = 0.1. Black, blue, and green lines indicate initial inclinations of 0°, 20°, and 180°, respectively. Top left: evolution of the semimajor axis. Top right: evolution of orbital eccentricity. Note the logarithmic scale. Bottom left: evolution of Mach number. Note the logarithmic scale. Bottom right: evolution of inclination. We plot only orbits with initial inclinations of 20°. The solid cyan line corresponds to an initially circular orbit, and the dashed magenta line corresponds to an eccentric orbit with an initial eccentricity of e = 0.1.
Other Images in This Article
Copyright and Terms & Conditions
© 2015. The American Astronomical Society. All rights reserved.