Image Details
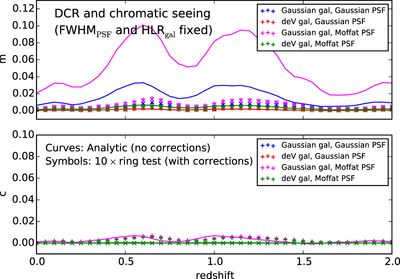
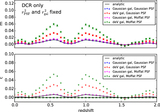
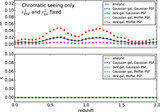
Caption: Figure 13.
Shear calibration parameters m and c due to both differential chromatic refraction and chromatic seeing. The colored curves correspond to 1× the analytic predictions for the uncorrected biases. The symbols correspond to 10× the ring-test predictions after the perturbative corrections to the PSFs described in steps 1 through 6 in Section 7 are applied. Details are the same as described in the caption for Figure 8, except that we hold fixed the PSF FWHM and galaxy half-light radius while investigating different assumed profiles (as in Figure 11). The vertical scale is the same as that in Figure 11. The largest residual chromatic biases after the PSF-level corrections are ﹩| m| \sim 0.0015﹩ and ﹩| c| \sim 0.0007﹩; these can be compared to the requirements given in Table 1 and described in the Note below the table.
Other Images in This Article


Show More
Copyright and Terms & Conditions
© 2015. The American Astronomical Society. All rights reserved.