Image Details
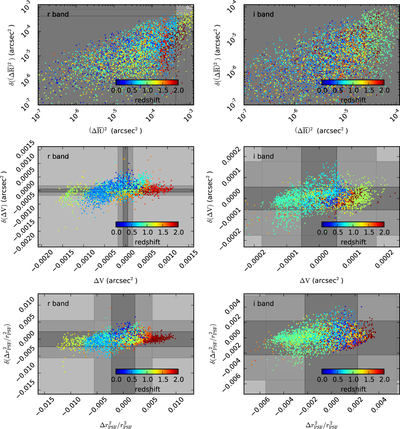
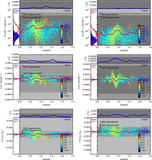
Caption: Figure 7.
Chromatic PSF bias residuals vs. uncorrected values for SEDs from the LSST CATSIM galaxy catalog. Each SED is represented by a colored point, with the color scale indicating the redshift. The shaded bands indicate requirements on each chromatic bias square-root-variance such that the resulting systematic uncertainty is less than the expected statistical uncertainty for the entire survey for DES (light gray outer band) and LSST (dark gray inner band). Note that the bands sometimes extend beyond the plotted regions.
Other Images in This Article


Show More
Copyright and Terms & Conditions
© 2015. The American Astronomical Society. All rights reserved.
Copyright ©
2025 Astronomy Image Explorer. All Rights Reserved.