Image Details
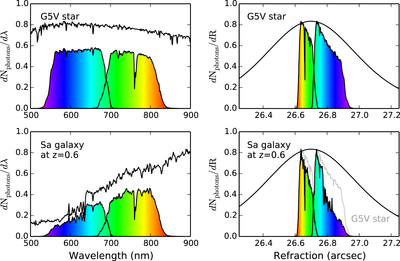
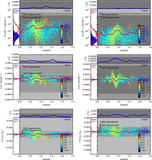
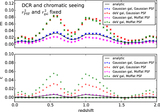
Caption: Figure 2.
Impact of differential chromatic refraction (DCR) for sample stellar (top) and galactic (bottom) SEDs. In the left panels, the black curves show the spectra of a G5V star (top) and an Sa galaxy redshifted to z = 0.6 (bottom). The rainbow-colored areas show the wavelength distribution (with arbitrary normalization) of detected photons from these SEDs after passing through the atmosphere and the LSST filters (r- and i-bands), optics, and sensors. In the right panels, we show the amount of refraction for a zenith angle of 35° for the same detected photons, with the same color coding (i.e., colored by wavelength) as the left panels. These distributions represent the DCR kernel that is convolved in the zenith direction with the seeing kernel, which is illustrated in the right panels as a β = 3.0 Moffat profile with FWHM of 0.7 arcsec (black curve). The DCR kernel for the G5V SED is lightly overplotted in the lower right panel to ease comparison. The difference between stellar and galactic SEDs therefore leads to different PSFs.
Other Images in This Article

Show More
Copyright and Terms & Conditions
© 2015. The American Astronomical Society. All rights reserved.