Image Details
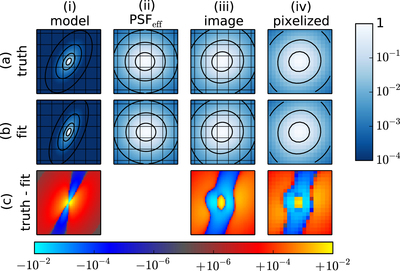
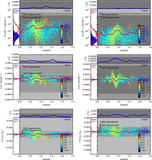
Caption: Figure 12.
Illustration of the simulation and fitting portion of the ring-test procedure (steps 8 and 9 in Section 6.1). The columns from left to right represent (i) the high-resolution model galaxy image before PSF convolution, (ii) the high-resolution effective PSF, (iii) the galaxy image convolved with the PSF, and (iv) the pixelation of (iii). The rows from top to bottom represent (a) the target galaxy model, galactic PSF, convolution, and pixelation, (b) the best-fit galaxy model, stellar PSF, convolution, and pixelation, and (c) the residuals (truth−best fit). Note the separate symmetric logarithmic axis for the color scale in the third row, with red corresponding to positive residuals and blue to negative residuals. The fit in step 9 minimizes the squared residuals, summed over pixels, for the image in the bottom right corner. The difference between the target and best-fit galaxy models (bottom left corner) illustrates the model bias induced by using the stellar PSF in the fit. In this figure, the galaxy profile is de Vaucouleurs (Sérsic index n = 4.0) both in the target image and fixed during the fit, the monochromatic PSF is a β = 3.0 Moffat profile with the effective galactic PSF derived from an Sa spectrum at redshift 0.6, and the effective stellar PSF derived from the spectrum of a G5V star. Both the physics of chromatic seeing and differential chromatic refraction are included. The zenith angle is set to 60°, and galaxy size set to ﹩{r}_{\mathrm{gal}}^{2}={(0.3\mathrm{arcsec})}^{2}﹩ to help visualize the effects.
Other Images in This Article


Show More
Copyright and Terms & Conditions
© 2015. The American Astronomical Society. All rights reserved.