Image Details

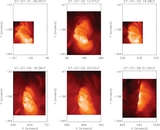
Caption: Figure 5.
Top (row 1): intensity image of AR 10961 in Si VII (left), Fe XIII (middle), and Fe XV (right) with white boxes (m1, m2, ..., m12) representing the 12 masked regions chosen for EM analysis. The bottom rows show the EM distributions of the 12 masked regions estimated with unrevised (row 2) and revised intensities (row 3), respectively.
Other Images in This Article
Copyright and Terms & Conditions
© 2014. The American Astronomical Society. All rights reserved.
Copyright ©
2025 Astronomy Image Explorer. All Rights Reserved.