Image Details
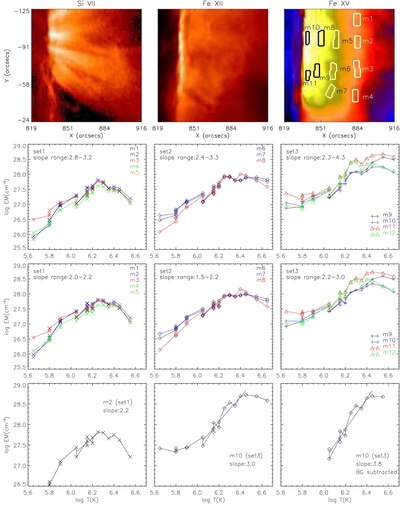
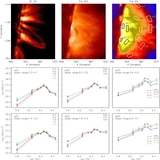
Caption: Figure 4.
Top (row 1): intensity image of AR 10939 in Si VII (left), Fe XIII (middle), and Fe XV (right) with white boxes (m1, m2, ..., m11) representing the 11 masked regions chosen for DEM analysis. Middle rows show the EMDs of all the masked regions estimated with unrevised (row 2) and revised (row 3) intensities, respectively. The bottom row shows the revised EMDs of a sample diffuse region (left), a core region (middle), and the same core region after background subtraction (right), with their corresponding linear fits and the derived slopes.
Other Images in This Article
Copyright and Terms & Conditions
© 2014. The American Astronomical Society. All rights reserved.
Copyright ©
2025 Astronomy Image Explorer. All Rights Reserved.