Image Details
Caption: Figure 9.
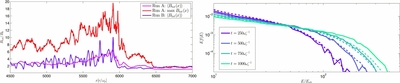
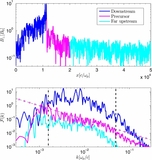
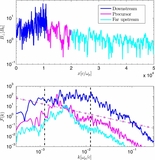
Comparison of runs with different transverse size for M = 20 parallel shock (Run A is five times larger than Run B; see Table 1). Left panel: magnetic field profiles, as in the legend; ![]() B
B![]() and max B correspond to the average over y and the maximum of Btot(x, y), as a function of x. max B in Run B is not shown since it almost coincides with
and max B correspond to the average over y and the maximum of Btot(x, y), as a function of x. max B in Run B is not shown since it almost coincides with ![]() B
B![]() . The averaged profiles are quite similar in the two runs, even if the spread from the mean value may locally be quite large in Run A. Right panel: time evolution of non-thermal spectra for Run A (dashed lines) and B (solid lines). Spectra agree very well until
. The averaged profiles are quite similar in the two runs, even if the spread from the mean value may locally be quite large in Run A. Right panel: time evolution of non-thermal spectra for Run A (dashed lines) and B (solid lines). Spectra agree very well until  , after which the diffusion length at Emax becomes comparable with the box size in Run A.
Other Images in This Article

Copyright and Terms & Conditions
© 2014. The American Astronomical Society. All rights reserved.