Image Details
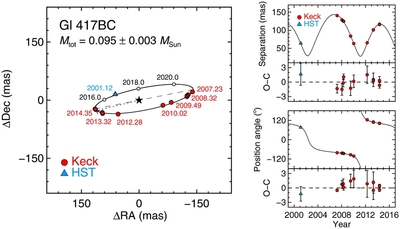
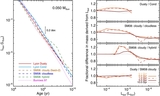
Caption: Figure 2.
Left: relative astrometry for Gl 417BC along with our best-fit orbit. Error bars for the data are smaller than the plotting symbols. The short dotted line indicates the time of periastron passage, the long dashed line shows the line of nodes, and small empty circles show predicted future locations. Right: measurements of the projected separation and P.A. of Gl 417BC. The best-fit orbit is shown as a solid line. The bottom panels show the observed minus computed (O − C) measurements with observational error bars.
Other Images in This Article
Copyright and Terms & Conditions
© 2014. The American Astronomical Society. All rights reserved.
Copyright ©
2025 Astronomy Image Explorer. All Rights Reserved.