Image Details
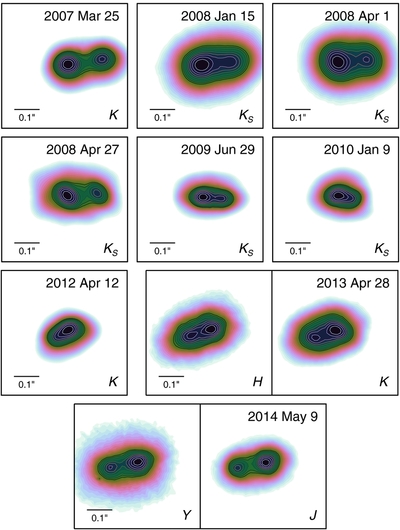
Caption: Figure 1.
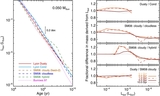
Contour plots of our Keck LGS AO images from which we derive astrometry and flux ratios (Table 1). Contours are in logarithmic intervals from unity to 7% of the peak flux in each band. The image cutouts are all the same size and have the same native pixel scale, and we have rotated them such that north is up for display purposes.
Other Images in This Article
Copyright and Terms & Conditions
© 2014. The American Astronomical Society. All rights reserved.
Copyright ©
2025 Astronomy Image Explorer. All Rights Reserved.