

Image Details
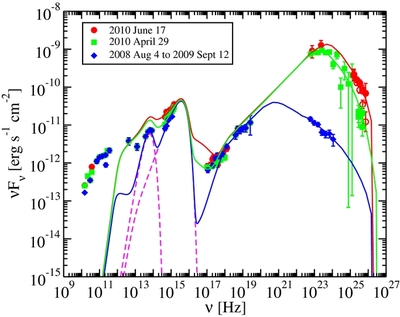
Caption: Figure 9.
Spectral energy distribution of 4C +21.35 in three epochs: 2010 June 17 (red circles), 2010 April 29 (green squares), and 2008 August 4–2009 September 12 (blue diamonds). Dashed magenta lines indicate the dust torus and accretion disk emission components. The MAGIC data have been corrected for EBL absorption using the model of Finke et al. (2010). Empty symbols refer to non-EBL-corrected data, filled symbols to EBL-corrected ones.
Other Images in This Article
Copyright and Terms & Conditions
© 2014. The American Astronomical Society. All rights reserved.

Copyright ©
2026 Astronomy Image Explorer. All Rights Reserved.
