

Image Details
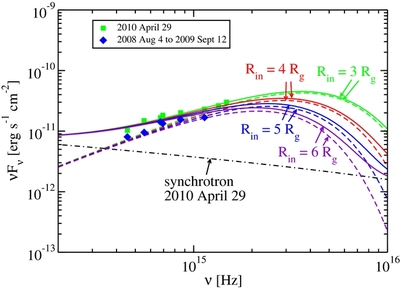
Caption: Figure 10.
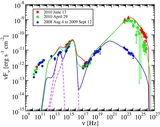
Similar to Figure 9, but zoomed in on the optical portion of the spectrum, which in our model originates mainly from disk emission. Model disk emission for several inner disk radii are shown (dashed curves), while the synchrotron from the model fit of 2010 April 29 is shown as the dot-dashed curve. The total (synchrotron + disk) emission is shown as the solid curves. Models with large inner disk radii do not provide an adequate fit to the UV data of 2010 April 29.
Other Images in This Article
Copyright and Terms & Conditions
© 2014. The American Astronomical Society. All rights reserved.

Copyright ©
2026 Astronomy Image Explorer. All Rights Reserved.
