

Image Details
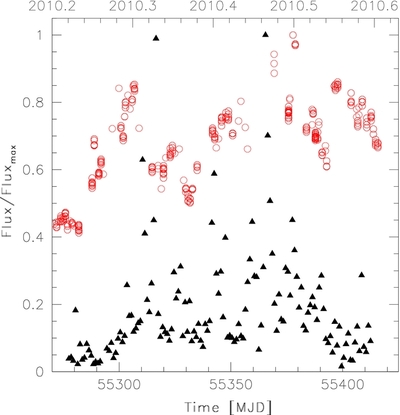
Caption: Figure 8.
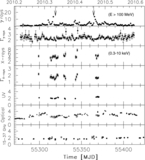
Comparison between γ-ray and R-band light curves. We superimpose γ-ray (black triangles) and R-band (red empty circles) light curves normalizing γ-ray and R flux values over the whole observing period to the respective peak flux values.
Other Images in This Article
Copyright and Terms & Conditions
© 2014. The American Astronomical Society. All rights reserved.

Copyright ©
2026 Astronomy Image Explorer. All Rights Reserved.
