Image Details
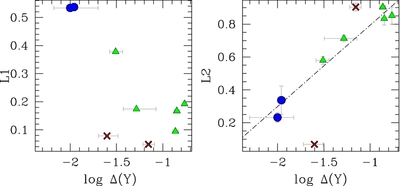
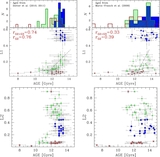
Caption: Figure 8.
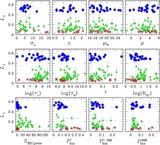
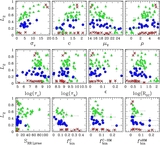
L1 (left panel) and L2 (right panel) as a function of the logarithm of the maximum helium difference among stellar populations in GCs. The black line is the best-fitting straight line for G2+G3 GCs.
Other Images in This Article
Show More
Copyright and Terms & Conditions
© 2014. The American Astronomical Society. All rights reserved.
Copyright ©
2025 Astronomy Image Explorer. All Rights Reserved.