Image Details
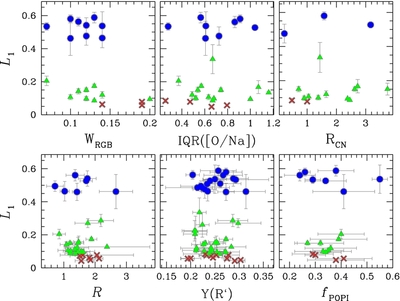
Caption: Figure 6.
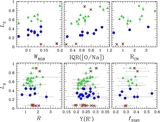
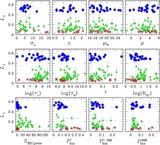
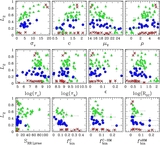
Upper panels: L1 as a function of the width of the RGB in the c UBI index (left), the interquartile range of the [O/Na] ratio (middle), and the ratio between CN-strong and CN-weak stars (right). Lower panels: L1 as a function of the R-parameter, which is the number ratio of HB to RGB stars brighter than the HB level (left); the helium abundance inferred by Gratton et al. (2010) from the Iben (1968) method based on the R-parameter (middle); and the fraction of first-population stars (right).
Other Images in This Article
Show More
Copyright and Terms & Conditions
© 2014. The American Astronomical Society. All rights reserved.
Copyright ©
2025 Astronomy Image Explorer. All Rights Reserved.