Image Details
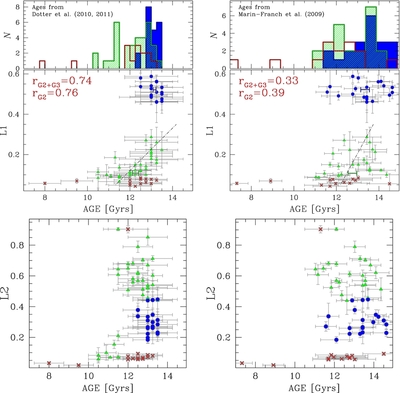
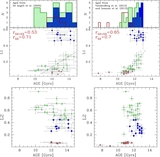
Caption: Figure 4.
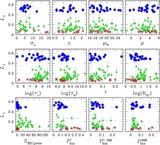
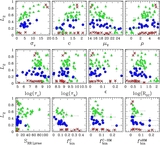
L2 (lower panels) and L1 (middle panels) against age. The histograms of age distribution for the G1 (red), G2 (green), and G3 (blue) GCs are plotted in the upper panel. In the left and right panels we used age measurements from Dotter et al. (2010, 2011) and Marín-Franch et al. (2009), respectively. Black dash-dotted lines in the middle panel are the best-fitting straight lines for the G2 sample. The Spearman's coefficients r G2 and r G2 + G3 are also indicated.
Other Images in This Article
Show More
Copyright and Terms & Conditions
© 2014. The American Astronomical Society. All rights reserved.
Copyright ©
2025 Astronomy Image Explorer. All Rights Reserved.