Image Details
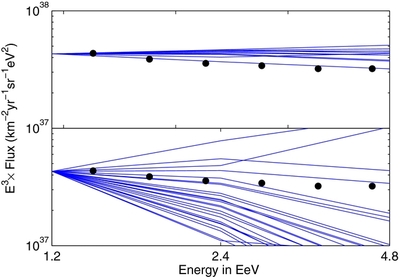
Caption: Figure 5.
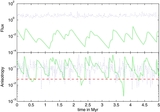
Proton spectra at the solar circle when anisotropy is below 2.3% at 2.4 EeV. The thin solid curves show spectra for randomly selected realizations of the source distribution. The black dots indicate the flux measured by Auger. In all cases, flux at 1.2 EeV is normalized to 4.3 × 10 37 km −2 yr −1 sr −1 eV 2. The mean free path λ mfp = r L and the GMF configuration is MF1. The top and the bottom panels are for the source rates 10 −2 yr −1 and 10 −4 yr −1, respectively. The source spectrum is assumed to be E −2.
Other Images in This Article
Copyright and Terms & Conditions
© 2014. The American Astronomical Society. All rights reserved.
Copyright ©
2025 Astronomy Image Explorer. All Rights Reserved.