Image Details
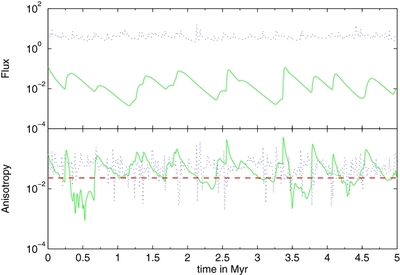
Caption: Figure 3.
Top panel: 5 Myr light curve of the local proton flux in arbitrary units for two different source rates: the dotted (blue) curve is for source rate 10 −2 yr −1, and the solid (green) curve is for 10 −4 yr −1. Bottom panel: Temporal variation of the anisotropy is plotted for two different source rates as in the top panel. The dashed (red) line indicates the 99% upper limit set by Auger. Here the GMF is chosen to be MF1 and λ mfp = r L .
Other Images in This Article

Copyright and Terms & Conditions
© 2014. The American Astronomical Society. All rights reserved.
Copyright ©
2025 Astronomy Image Explorer. All Rights Reserved.