Image Details
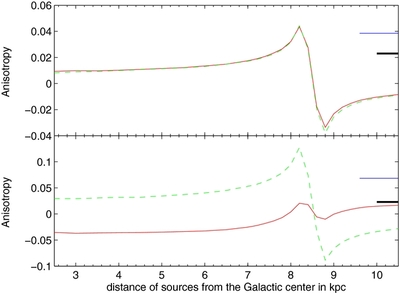
Caption: Figure 2.
Anisotropy (in arbitrary units) due to all sources that lie at a distance d from the Galactic center is plotted against d. Here, the GMF is assumed to be MF3. In the top panel, λ mfp = r L and in the bottom panel, λ mfp = 3 r L . Solid (red) and dashed (green) curves represent anisotropy along the radial and z-direction, respectively. The thick black bar in the right panel indicates the observed 99% upper limit set by Auger, and the thin blue line indicates the mean anisotropy assuming that the sources are distributed in proportion to the star formation rate (Equation (7)).
Other Images in This Article

Copyright and Terms & Conditions
© 2014. The American Astronomical Society. All rights reserved.