Image Details

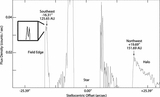
Caption: Figure 21.
Sample of 30 orbits from Figure 20, viewed face-on (top) and edge-on (bottom) with the same orientation as the deprojected images shown in Figure 13. The dashed black line represents the main belt, with pericenter to the lower left. The ascending (red dots) and descending (blue dots) nodes with respect to the belt plane are mostly concentrated within the perimeter of the belt.
Other Images in This Article
Show More
Copyright and Terms & Conditions
© 2013. The American Astronomical Society. All rights reserved.
Copyright ©
2025 Astronomy Image Explorer. All Rights Reserved.