Image Details

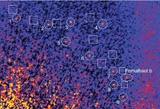
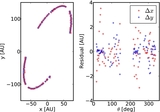
Caption: Figure 8.
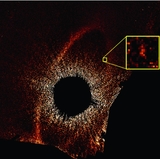
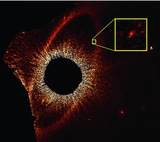
Mosaic of the 2010 and 2012 STIS data registered to the location of Fomalhaut A. In the central regions of overlap (see Figures 2 and 4) this combined figure represents the average value from the two epochs of observation, which means that background objects and Fomalhaut b are blurred due to their motion between epochs. North is up, east is left. The circle and diamond mark the stellar center and the geometric center of the belt, respectively. The data are not smoothed.
Other Images in This Article
Show More
Copyright and Terms & Conditions
© 2013. The American Astronomical Society. All rights reserved.
Copyright ©
2025 Astronomy Image Explorer. All Rights Reserved.