Image Details
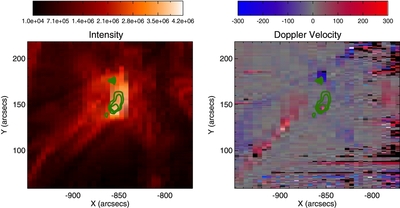
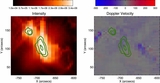
Caption: Figure 5.
Fe xxiv intensity (erg cm −2 s −1 str −1 Å −1), velocity (km s −1), and non-thermal velocity (km s −1) at the peak time of the non-thermal velocity (see Figure 4) during the intermediate flare. Green contours represent non-thermal velocities of 100, 140, and 180 km s −1.
Other Images in This Article

Show More
Copyright and Terms & Conditions
© 2013. The American Astronomical Society. All rights reserved.
Copyright ©
2025 Astronomy Image Explorer. All Rights Reserved.