Image Details
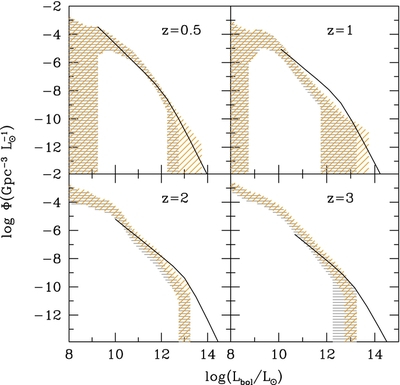
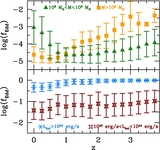
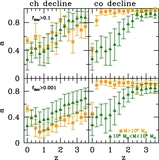
Caption: Figure 3.
Luminosity function at different redshifts. We show here the minimum and maximum values, considering both 1σ statistical uncertainties, using Poissonian statistics, and the fraction of absorbed AGNs (La Franca et al. 2005). Orange (45° hatching): coherent accretion during the decline of the quasar phase. Gray (horizontal hatching): chaotic accretion during the decline of the quasar phase.
Other Images in This Article
Copyright and Terms & Conditions
© 2013. The American Astronomical Society. All rights reserved.
Copyright ©
2025 Astronomy Image Explorer. All Rights Reserved.