Image Details
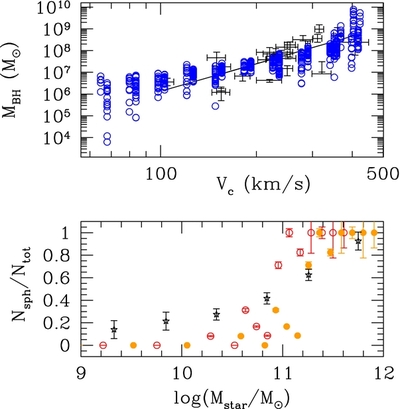
Caption: Figure 2.
Top panel: relationship between MBH mass and circular velocity. The circles are model MBHs at z = 0 and the error bars show the datapoints collected in Kormendy et al. (2011) and the best fit derived in Volonteri et al. (2011c). Bottom panel: fraction of spheroids as a function of stellar mass. We scale from halo mass to stellar mass through the data described in Figure 1 of Hopkins et al. (2010), assuming that a fixed fraction (10%–50%) of the baryons is in stars (open red points and filled orange points, respectively). We compare the fraction of spheroids to the result of Conselice (2006).
Other Images in This Article
Copyright and Terms & Conditions
© 2013. The American Astronomical Society. All rights reserved.